Person Re-Identification idea in MNIST
Closed-World and Open-World
Spatial-Temporal Representation(SR)
MNIST with Siameses Network
Our steps:
1. Use Simaese Network to extract the Feature Vector(128 dimension) of MNIST dataset
1)Convert MNIST dataset to each class dataset: Details in MNIST_image_proc.py
2)Train
We need to use Dropout during the training process
Up till now, we think we should not normalize 16 dimensional network output(In the later part of this paper, we call the output of network as feature vector), for we think normalized feature vector will cause the distance between different class less significant
Some problems we encounter and the solution:
change conv1d to conv2d
Solve the dimension question(3 to 1) Solved
RuntimeError: Given groups=1, weight of size [64, 1, 3], expected input[1, 28, 28] to have 1 channels, but got 28 channels instead
solution: “self.c2 = nn.Sequential(nn.Conv2d(in_channels=64, out_channels=512, kernel_size=3),nn.MaxPool2d(kernel_size=2, stride=2),nn.Dropout2d(p=0.1),nn.AdaptiveMaxPool2d((1, 1)))”RuntimeError: mat1 and mat2 shapes cannot be multiplied (512x1 and 512x1024)
solution: nn.Flatten(0,-1)RuntimeError: Expected 3D (unbatched) or 4D (batched) input to conv2d, but got input of size: [28, 28]
solution: test_out = net(torch.reshape(test[0][0][0],(1,28,28)))net.load_state_dict(torch.load(pthfile)):
RuntimeError: Attempting to deserialize object on a CUDA device but torch.cuda.is_available() is False. If you are running on a CPU-only machine, please use torch.load with map_location=torch.device(‘cpu’) to map your storages to the CPU.
solution:temp = torch.load(pthfile,map_location=DEVICE)
net.load_state_dict(temp)
- error after add batch normalization:ValueError: expected 4D input (got 3D input)
out0 = net(torch.reshape(cur_batch_x[0],(1,1,28,28)))
out1 = net(torch.reshape(cur_batch_x[1],(1,1,28,28)))
out2 = net(torch.reshape(cur_batch_x[2],(1,1,28,28)))
AttributeError: ‘int’ object has no attribute ‘backward’
change triple loss to:
def triplet_loss(plot1,plot2,plot3,margin):
# anchor = plot1
# positive = plot2
# negative = plot3
dis_ap = torch.pow(F.pairwise_distance(plot1,plot2),2)
dis_an = torch.pow(F.pairwise_distance(plot1,plot3),2)
loss = torch.max(dis_ap-dis_an+margin,0)
return loss
AttributeError: ‘torch.return_types.max’ object has no attribute ‘backward’
solution:
loss,temp = torch.max(dis_ap-dis_an+margin,0)
The above solution is not practical, we use:
loss = F.relu(dis_ap-dis_an+margin)
2. Choose a group of test data(must include all classes) and test them in the Network we trained,we set a threshold to distingish different class, if a image’s Feature Vector distance to all other groups’ distance is larger than the threshold, we classify it as a new class, else, group it into the class of cloest distance
Attention: There is not need for us to classify whether the test image belongs to the right class as input We just need to decide how many class we have and when input a new image, we classify it to the correct class
First thought:
In order to set the distance threshold correctly we need to calculate the distance below:
- The distance between each point in same class
- The distance between each point in the class and the barycenter of this class
- The distance between each point and barycenter of other class
This is the first thought of us to calculate the threshold
But the experimental result shows that the accuracy of the above way is just about 80%, which does not reach our expectation, so we think the problem may caused by the cluster so we look through different cluster algotithm and we find that Density-Based Spatial Clustering of Application with Noise may be helpful. We think that we should not calculate the barycenter for it will introduce error in the threshold setting.
Clustering algorithm:
K-Means: We have to set the class number we want to cluster before the clustering process, in MNIST task, this is correct, but in person Re-ID, this is definitely incorrect
DBSCAN: We just reference its idea rather than use it entirely
S
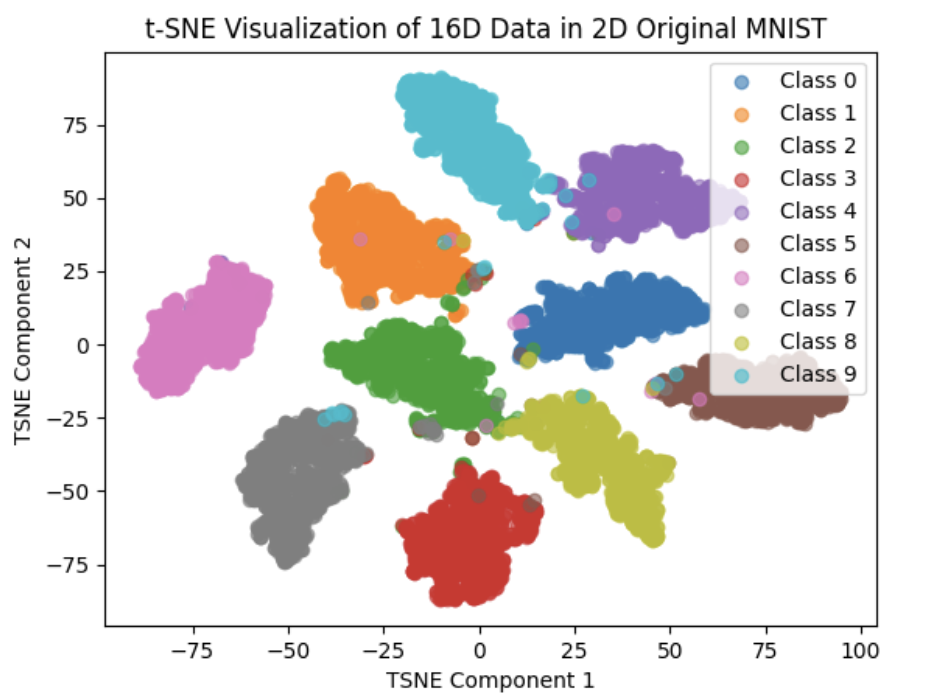
T-SNE Visualization high dimensional data, we can use t-SNE to convert 16 dimension feature vector to 2 dimensional data points and thus we can output it in a understandable 2D plot
When we use t-SNE to convert it to 3D data points, we encounter a problem:
plt.scatter(res[i, 0], res[i, 1], res[i, 2], c=colors[j], alpha=0.6)
solution: plt.scatter is just suitable for 2D drawing, for 3D drawing,we need to use mpl_toolkits.mplot3d.Axes3D ans ax.scatter
Use matplotlib to draw plot: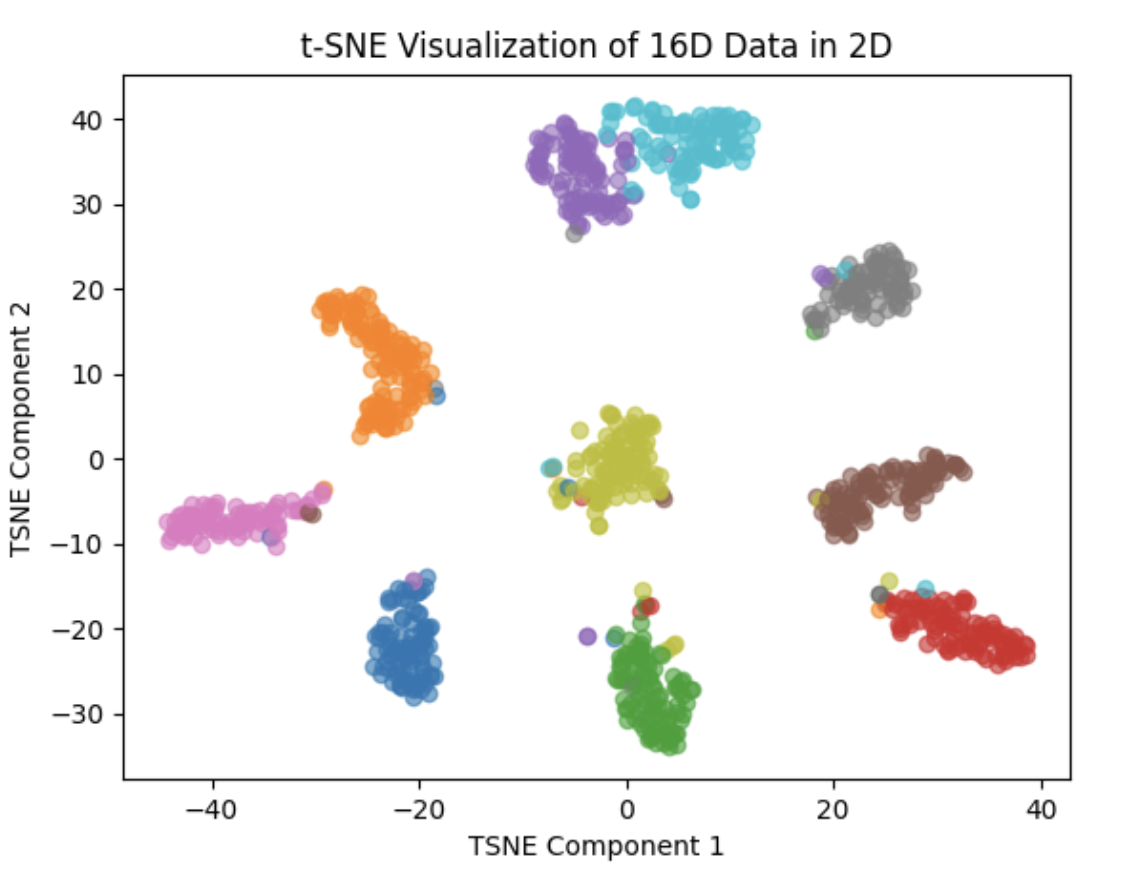
The above 3 images scatter random 1K points to 2D space
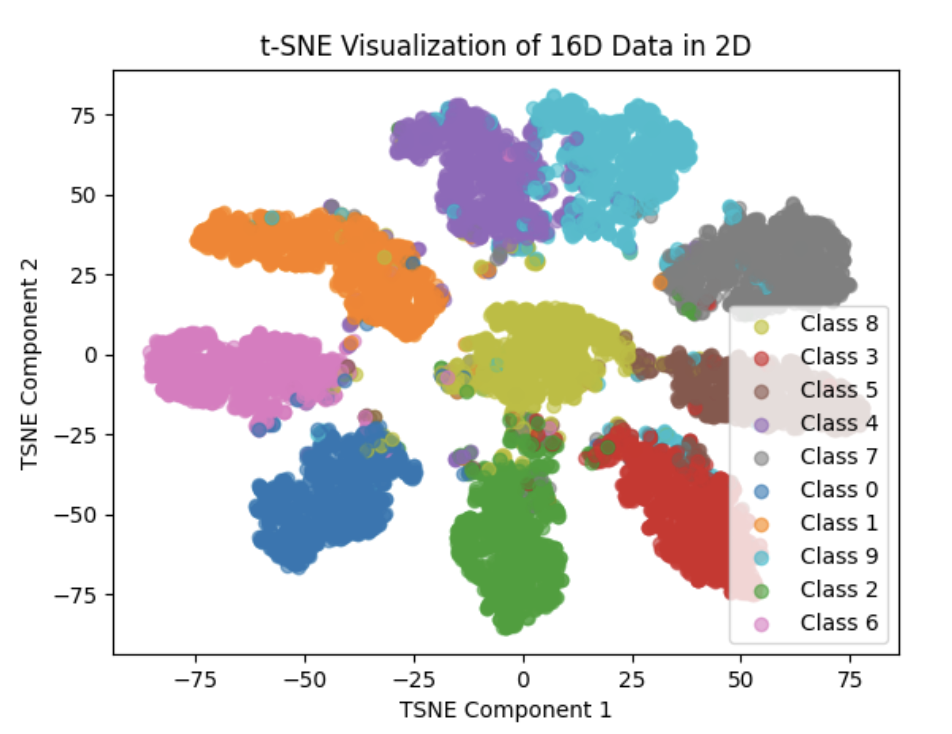 The above image scatter 10K(all the test dataset) points to 2D space
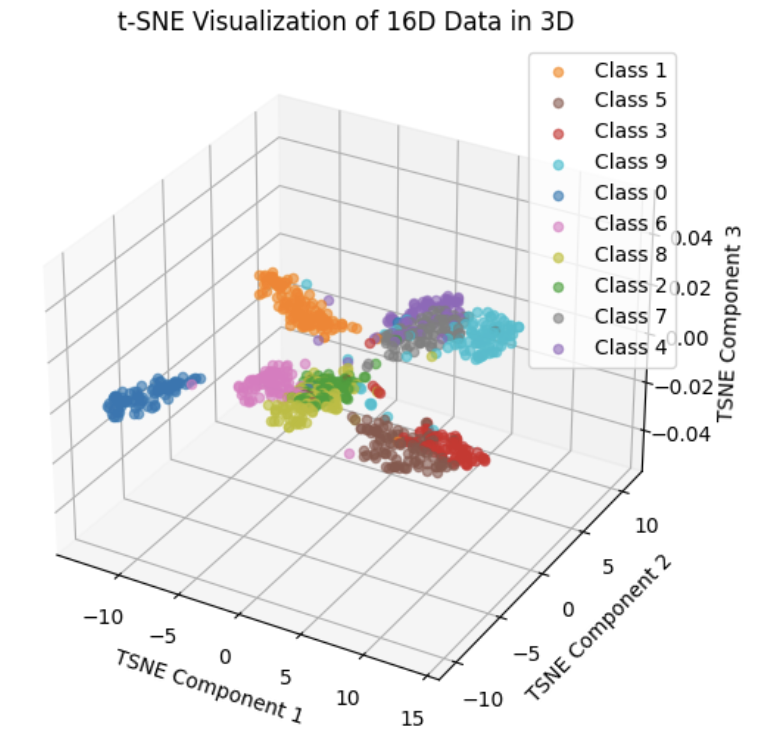 The above image scatter random 1K points to 3D space
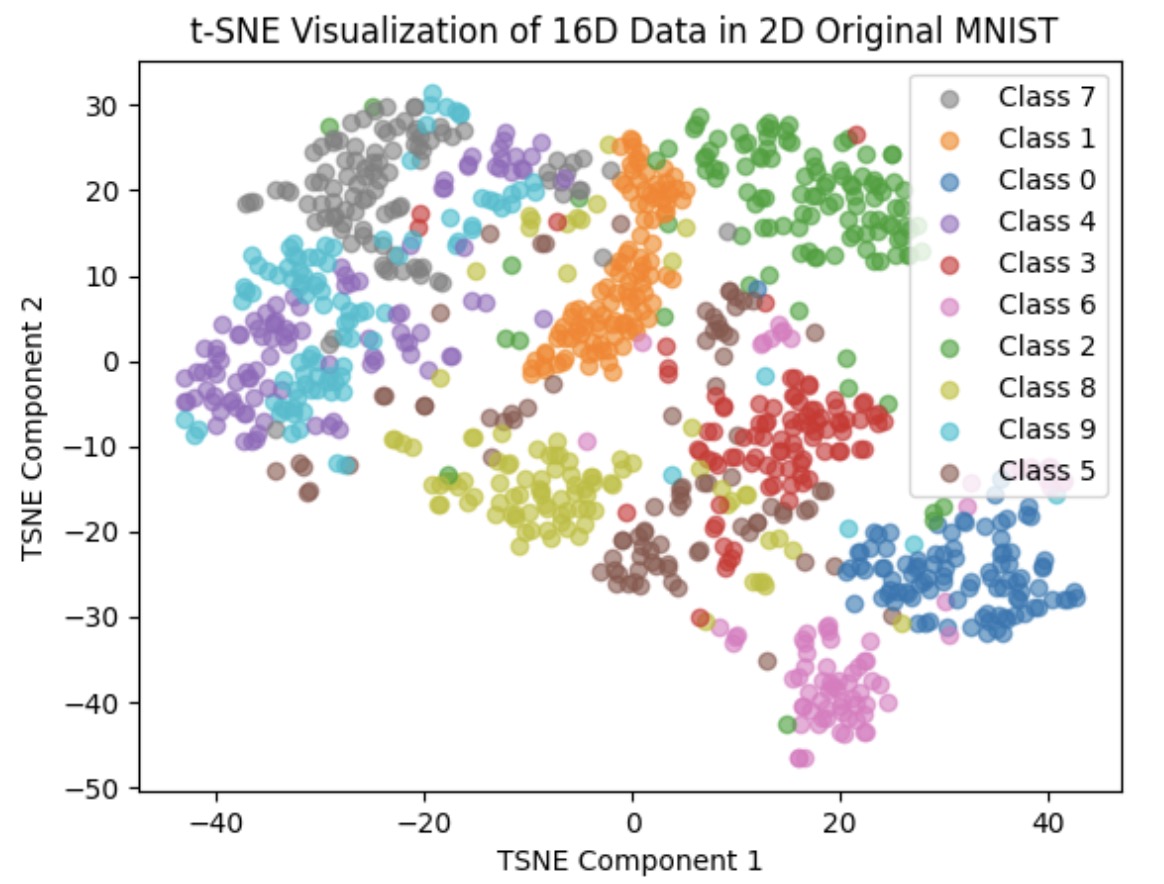
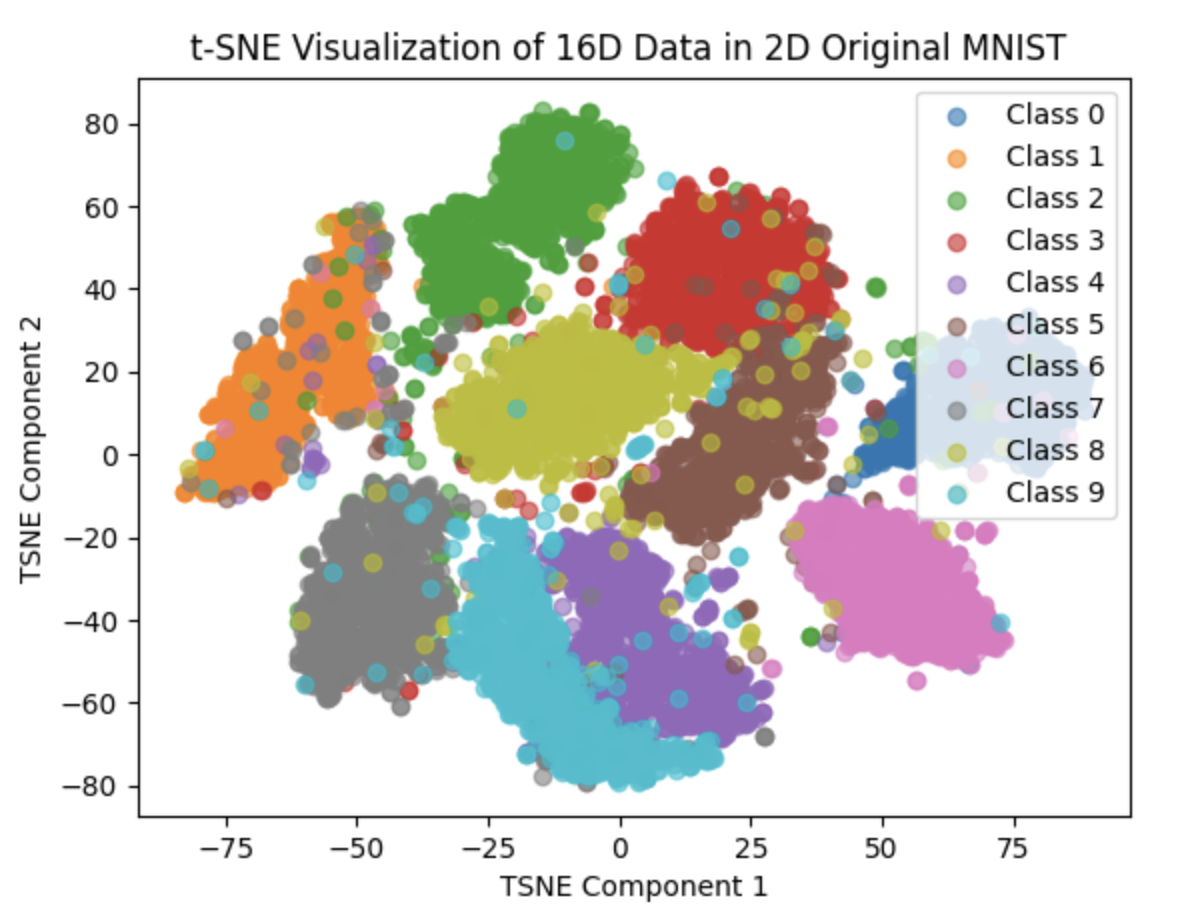 The last image is plot of scattering 1K and 10K original 28*28 image into 2D space respectively
We can clearly see that the Feature Vector of our net are higher clustered
And we find that 3D plot is hard to analysis, we want to use plotly to draw better plot
3. We need to calculate the barycenter during the test process
We first use 100 test image to vertify the correctness of our code
What we need to calculate:(We assume that we have already know the class of each test image,i.e. from class 0 to 9, each class has 10 different images)
- The distance between this point and all the other 100-1 = 99 points
- The distance between this point and all class barycenters(10)
- The distance between all the class barycenters
- The distance between this point and all its same class points and the distance between this points and all its different class points
- The mean distance and standard deviation in class
- The distance sequence in class(downwards) and the distance sequence between class(upwards)
- The mean distance and standard deviation in same class between points and barycenter
When we do the process 4, we need to deep copy the distance from one point to all the other points
And we encounter encounter a problem:
RuntimeError: Only Tensors created explicitly by the user (graph leaves) support the deepcopy protocol at the moment
solution:
for i in range(len(point_distance)):
between_class_distance.append(point_distance[i])
for i in range(total_image_class):
temp_dist_list = []
for j in range(each_class_number):
del between_class_distance[ieach_class_number+j][ieach_class_number:(i+1)*each_class_number]
Since point_distance is a list consist of tensor list, all the other ways that use deepcopy needs to iterate all the element in point_distance, so iterating is also ok and easy to understand
The 7-th idea comes out when we want to set threshold, as there are many data point, we can assume they follows standard Gaussia distribution, so we can set mu + 3 sigma as the threshold.
The mean and standard deviation are as below: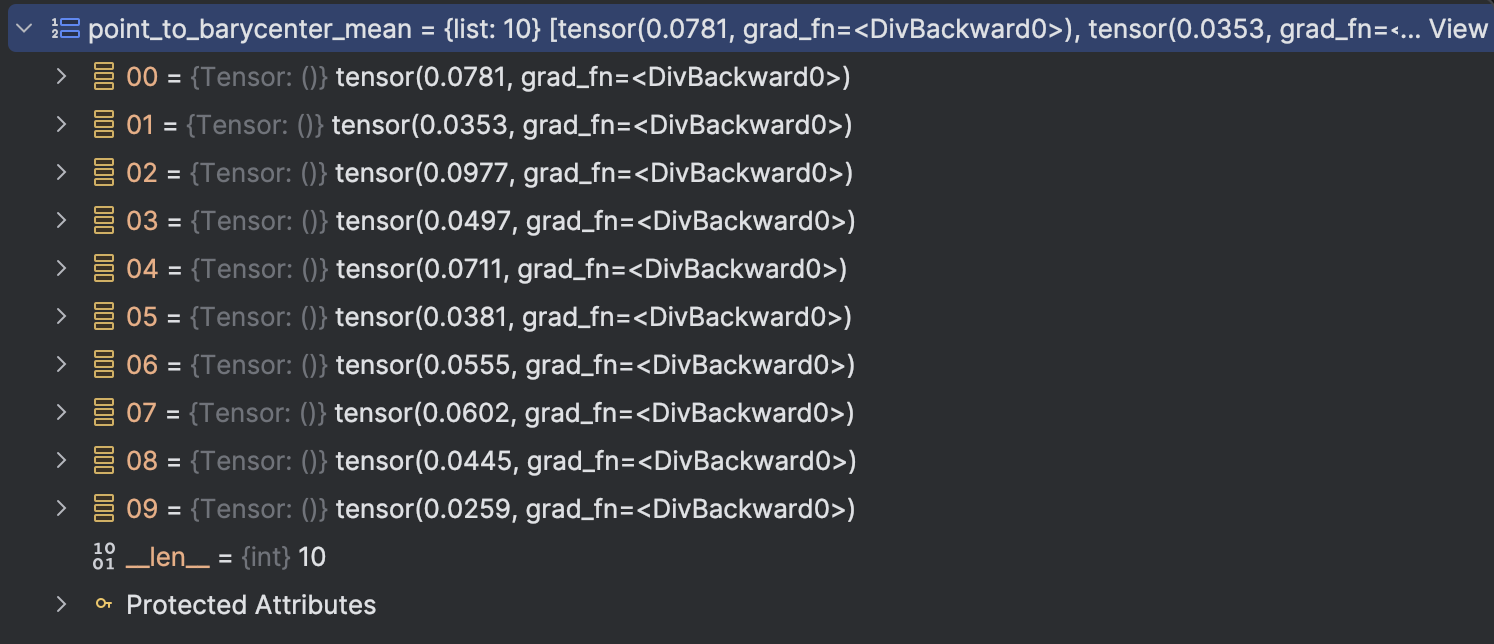
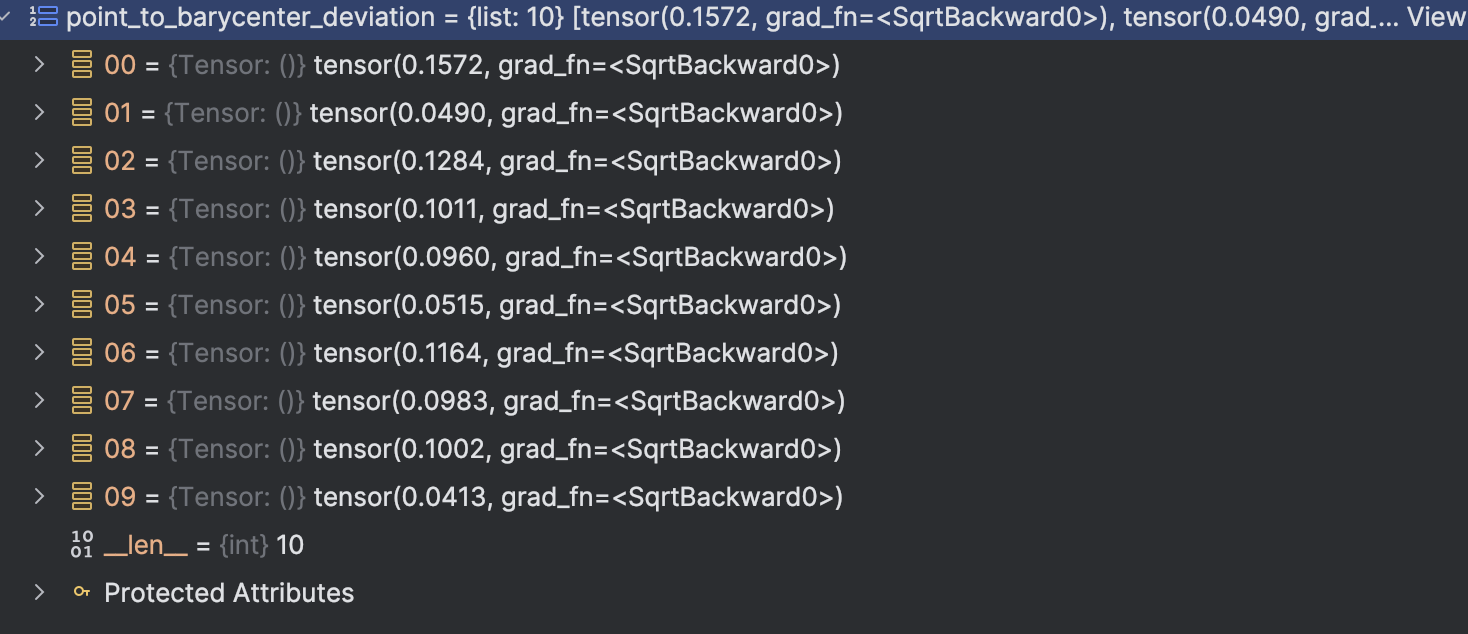
We can see that the mean + 3 standarddeviation is really, which is very different as the threshold we test(0.68) So we should use another way to “calculate” it. Currently, we just use humanly try to calculate the threshold
Some new idea:(1st Feb)
- Normalize feature vector space(For after we normalize vector, the max distance is solid(2), thus we can more easily figure out the threshold)
or we can use cosine_simility as distance - How to calculate whether the new point belongs to a new class or an original class:
- we first calculate the distance between the new point and all the existing class barycenter
- For the first few frames(T1, we will set it later),we set a threshold to judge
- For the later frames, we calculate the mean + - 3 sigma and judge which class it has most high probability
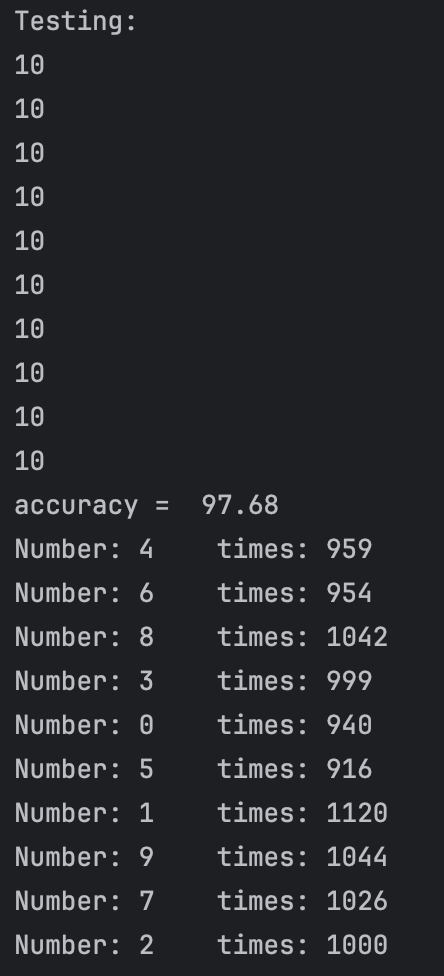
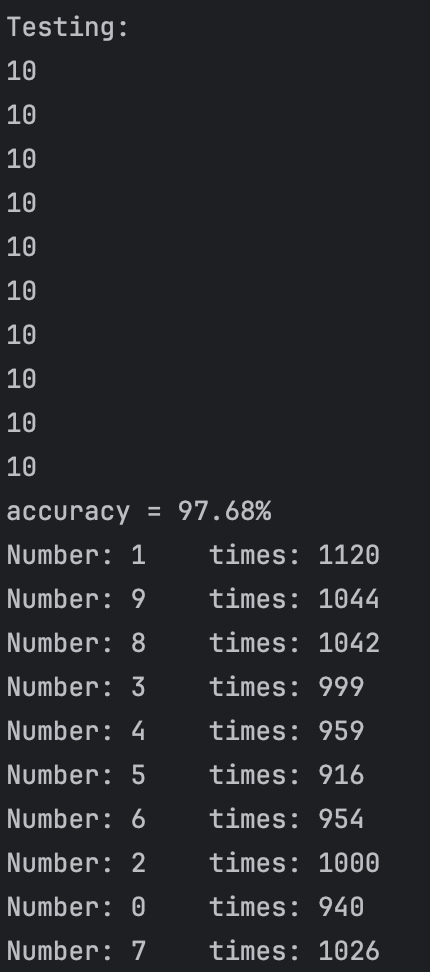
4. The expected result of the lab is output 10: meaning we have 10 different class(0 to 9)
2nd Feb
We change loss function to cosine_simility as distance(distance = 1 - cosine_simility),and we train the net, we find that the effect is extremely excellent.
Except class 2,3,4 and 9.
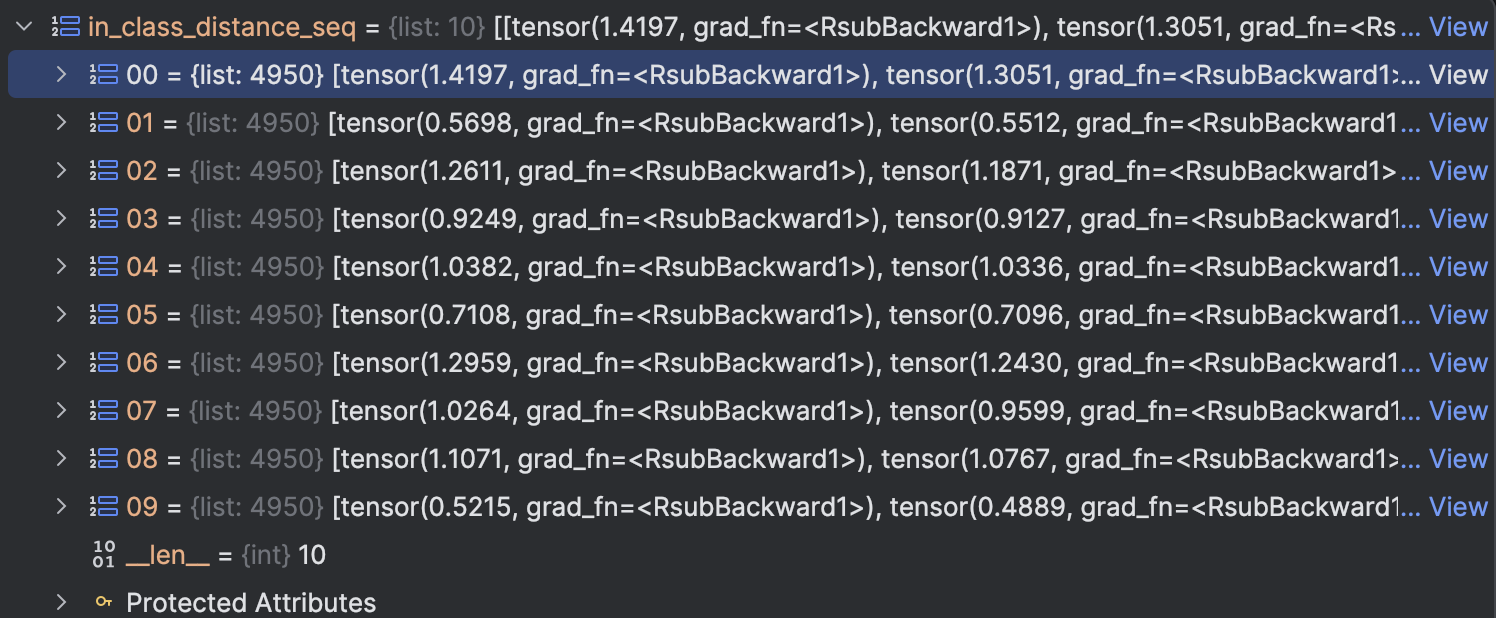
The result can be seen in below figures: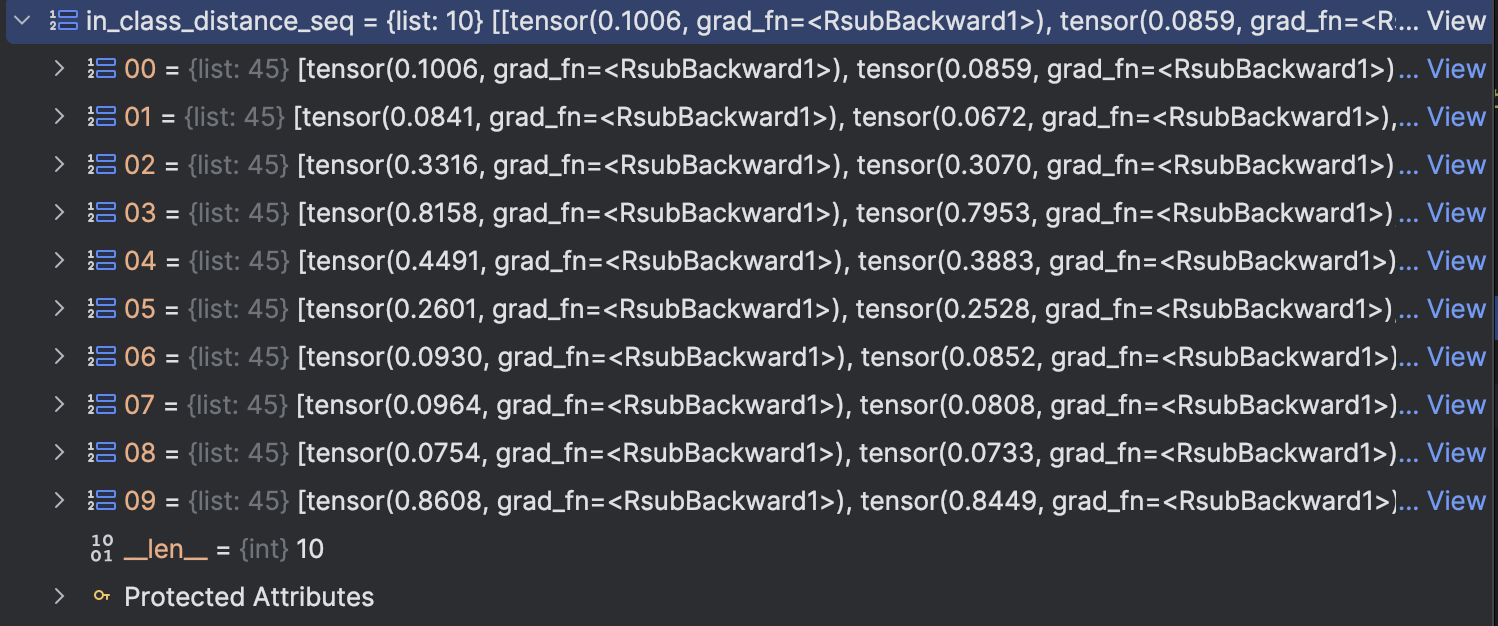 in_class_distance_seq is the distance within class of each class, we sort it downwards. meaning that the bigger the distance is, the more front it will be.
We can see that except 2,3,4,9 all the other class max in class distance is at most 0.2, but this 4 classes is very large
in_class_distance_seq is the distance within class of each class, we sort it downwards. meaning that the bigger the distance is, the more front it will be.
We can see that except 2,3,4,9 all the other class max in class distance is at most 0.2, but this 4 classes is very large
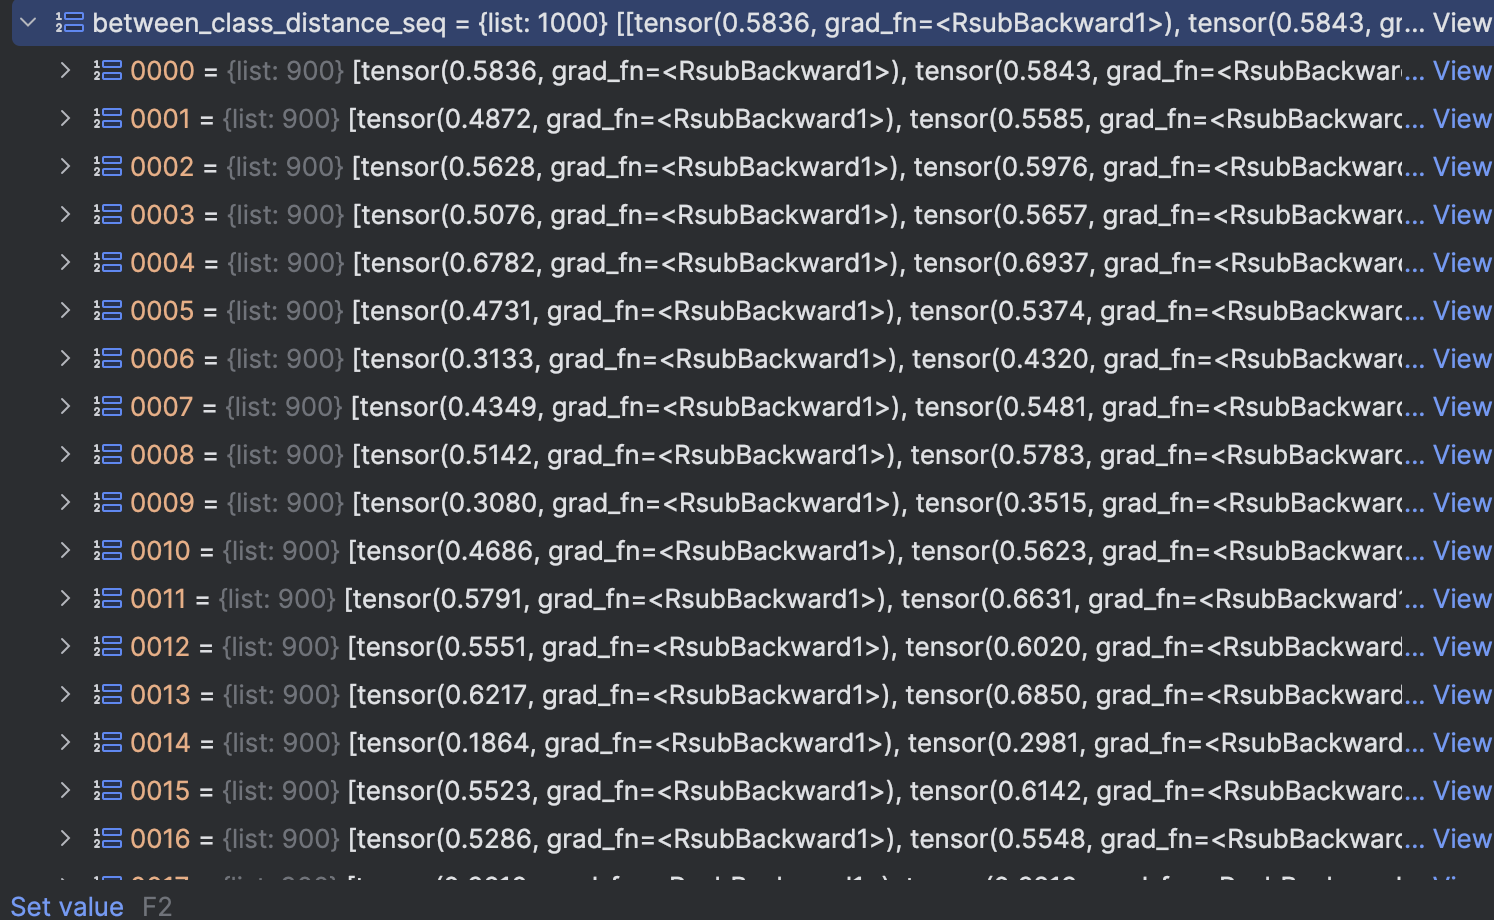
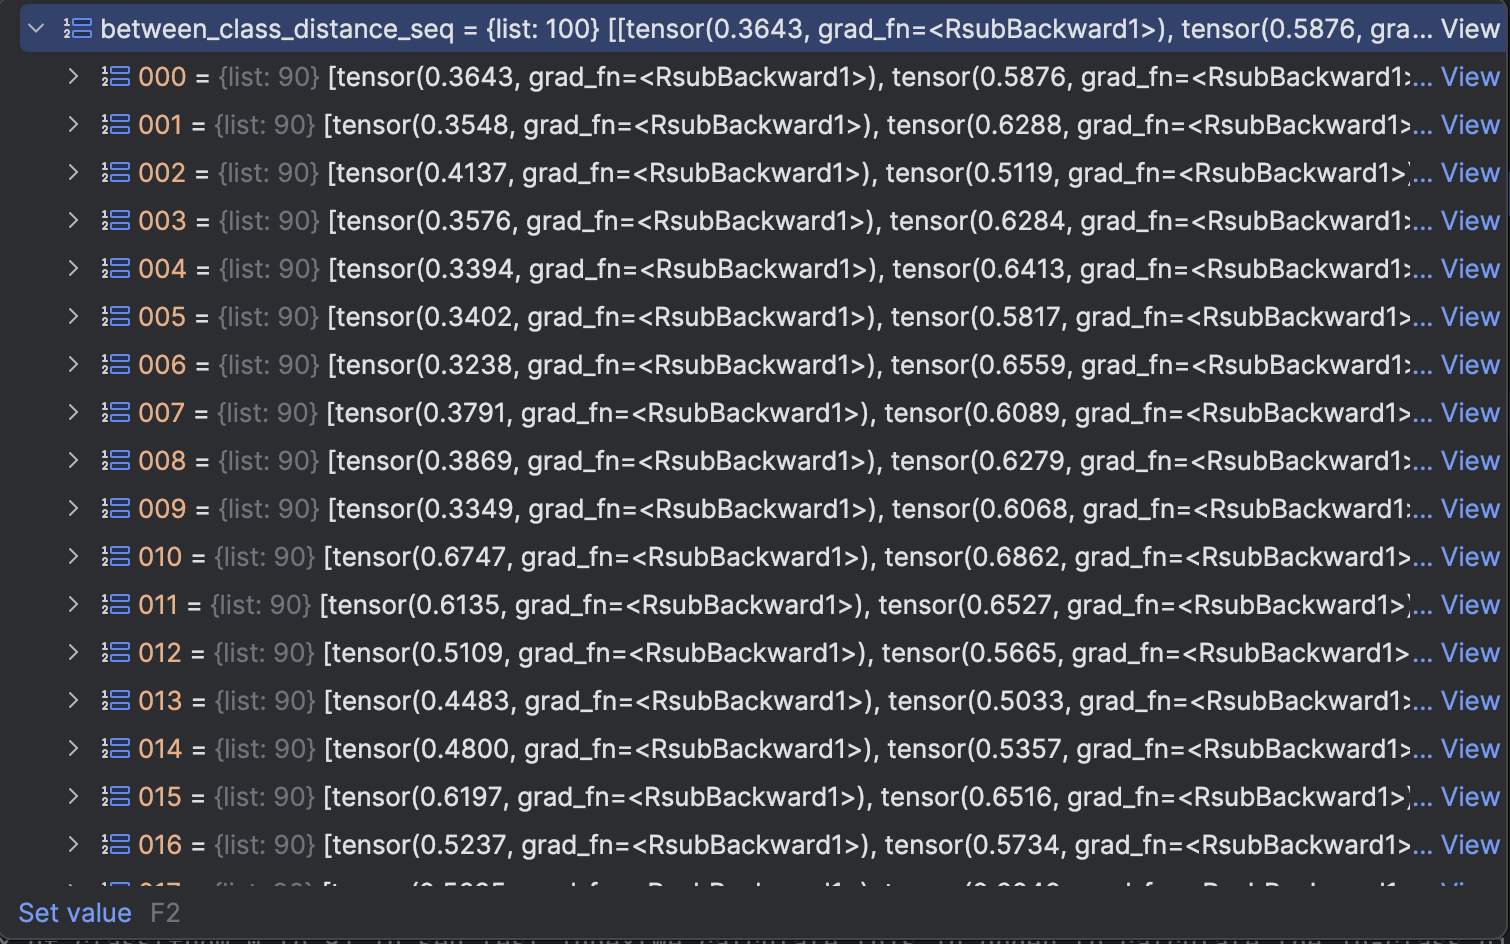 between_class_distance_seq is the distance between class, we sort it downwards. meaning that the smaller the distance is, the more front it will be.
We can see that all first element of distance is above 0.3
Thus we can set different class threshold to a distance between 0.1 to 0.3
Under this circumstance, the Visualization of feature space are as below:
between_class_distance_seq is the distance between class, we sort it downwards. meaning that the smaller the distance is, the more front it will be.
We can see that all first element of distance is above 0.3
Thus we can set different class threshold to a distance between 0.1 to 0.3
Under this circumstance, the Visualization of feature space are as below:
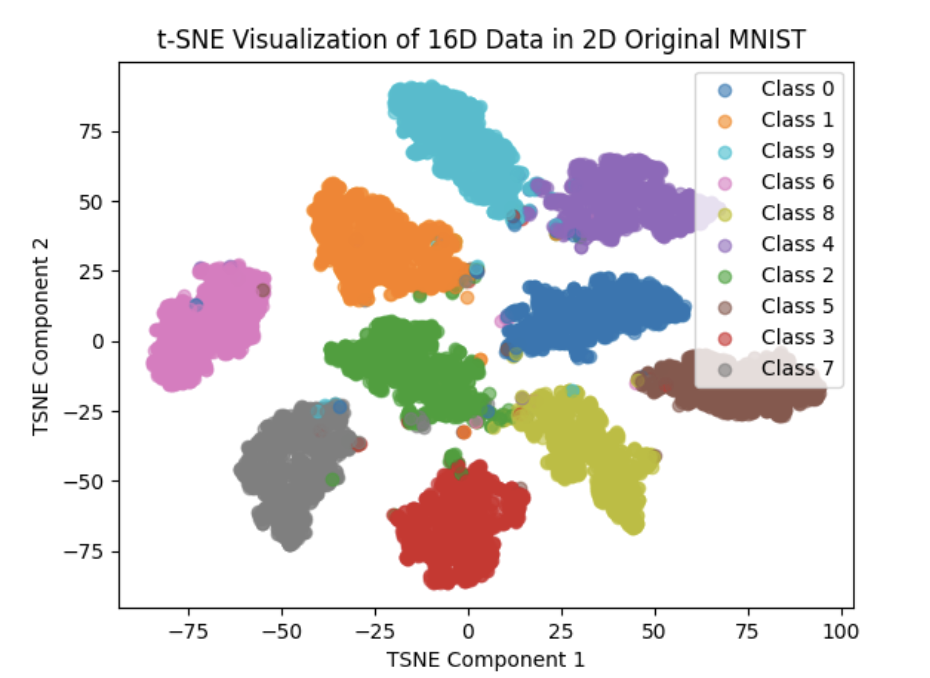 We can clearly see that the effect are greatly improved compared to Euclid Distance(We replace Euclid distance with cosine_simility distance)
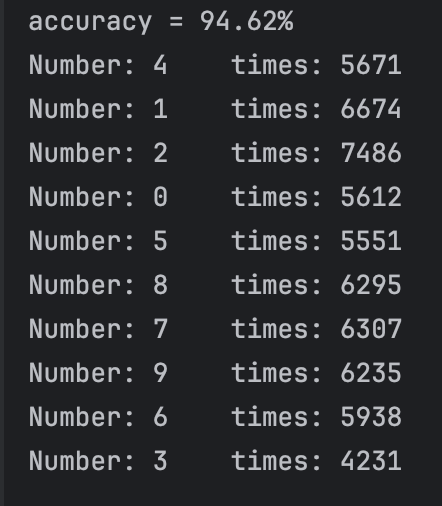
We do more experiment in 100 number in each class to approximate calculte the different class threshold
The in_class_distance_seq and between_class_distance_seq meaning we have discussed before, the 10 images for each number(class) and 100 images for each number(class) are as below:
1K:
10K:
We can clearly see that the effect are greatly improved compared to Euclid Distance(We replace Euclid distance with cosine_simility distance)
We do more experiment in 100 number in each class to approximate calculte the different class threshold
The in_class_distance_seq and between_class_distance_seq meaning we have discussed before, the 10 images for each number(class) and 100 images for each number(class) are as below:
1K:
10K:
 After our test,we find that if we set threshold between 0.68 and 0.8, in most cases(since our test dataset sequence is random), we can get 10 class and the accuracy can reach more than 95%
Reference:
[1]
[2]